Analog / Signal Processing
ECG Signal Conditioning
Investigated ECG amplification and analog filtering with an AD627 instrumentation amplifier, LT1490 active filters, and preparation for data acquisition.
01 / Overview
Project at a glance.
Instrumentation amplification and active filtering prepare a small ECG signal for acquisition, with separate MATLAB exercises exploring synthetic-signal processing.
02 / System approach
How the pieces connect.
A simplified view of the functional path. Original artifacts and detailed evidence follow below.
- 01Differential signal
- 02AD627 amplifier
- 03High-pass / low-pass
- 04Acquisition preparation
From a small signal to a conditioned output
EECE 2150, Circuits and Signals: Biomedical Applications, combines circuit theory, signal processing, circuit construction, and MATLAB in an integrated lecture/lab course. It connects differential amplification, active filters, and analog/digital conversion through biomedical signal work.
This EECE 2150 project investigated ECG amplification and analog signal conditioning across Labs 14 and 15. The work combined an AD627 instrumentation amplifier with LT1490 active filters to address signal amplitude, baseline drift, and high-frequency noise before data acquisition.
Hardware
AD627 instrumentation amplifier · LT1490 op amps · battery-powered circuit · NI USB-6001 acquisition device
Project record
Lab 14 and Lab 15 reports dated December 12, 2025.
To add: individual contribution details and original circuit or measurement captures.
The analog signal chain
Instrumentation amplification
Lab 14 used the AD627 to investigate differential gain, bandwidth, and common-mode rejection. The report describes a gain near 25 and subsequent ECG acquisition.
Baseline conditioning
Lab 15 describes a first-order LT1490 high-pass stage with an approximately 0.5 Hz cutoff and unity gain, intended to remove DC offsets and slow baseline drift without adding excessive amplification.
High-frequency attenuation
A first-order low-pass stage with an approximately 34 Hz cutoff and gain near 2 attenuated high-frequency content before digitization. Cascading the stages formed the reported band-pass response.
Acquisition and analysis boundary
The Lab 15 introduction identifies the NI USB-6001 as the acquisition device. Its conclusion explicitly states that ECG signals were not processed in MATLAB; completed digital analysis of the acquired ECG is therefore not claimed here.
Building and checking the front end
Establish the supply and reference
Lab 14 powered the AD627 from two 1.5 V batteries to create ±1.5 V rails. The REF pin was connected to ground, and supply bypass capacitors reduced supply noise and transients. This established the operating conditions before the signal tests.
Test with a known differential input
A 10 Hz sine wave was applied to one input while the other was grounded. Comparing approximately 30 mV peak-to-peak input with 750 mV peak-to-peak output gave a differential gain near 25.
Check bandwidth and common-mode response
The input frequency was increased until the gain fell to approximately 0.707 of its maximum. A separate test drove both inputs with the same signal to estimate common-mode gain. The report gives approximately 8 kHz bandwidth and 82 dB common-mode rejection.
Condition the electrode signal
After the amplifier tests, electrodes replaced the function generator. Lab 15 identifies electrode contact potentials as a source of DC offset, motivating the 0.5 Hz high-pass stage. The LT1490 was selected for operation near the low-voltage supply rails and low input bias current.
Balance gain and noise filtering
The high-pass stage retained unity gain to limit saturation risk. The low-pass stage added gain near 2 while attenuating higher-frequency content. Cascading the stages targeted approximately 0.5–34 Hz before sampling.
Supporting acquisition and filter investigations
DAQ sampling · Lab 8
The report describes configuring a National Instruments USB-DAQ in MATLAB and sampling a 500 Hz sine wave at 10,000 samples per second for 0.01 seconds. Separate audio tests compared 20 kHz, 5 kHz, and 1 kHz sampling, with the lower-rate recordings sounding increasingly different from the source.
These settings belong to the earlier sampling exercises; the reports do not confirm them as the ECG acquisition settings.
Active-filter simulation · Lab 10
LTspice AC sweeps of an LT1490 low-pass circuit produced cutoff values of 158.5 Hz and 159.1 Hz at two input amplitudes. Square-wave tests showed rounded transitions for the low-pass configuration and edge-focused responses for the high-pass configuration.
This supports the filter-development background rather than a measured response of the final ECG circuit.
Original MATLAB filtering result
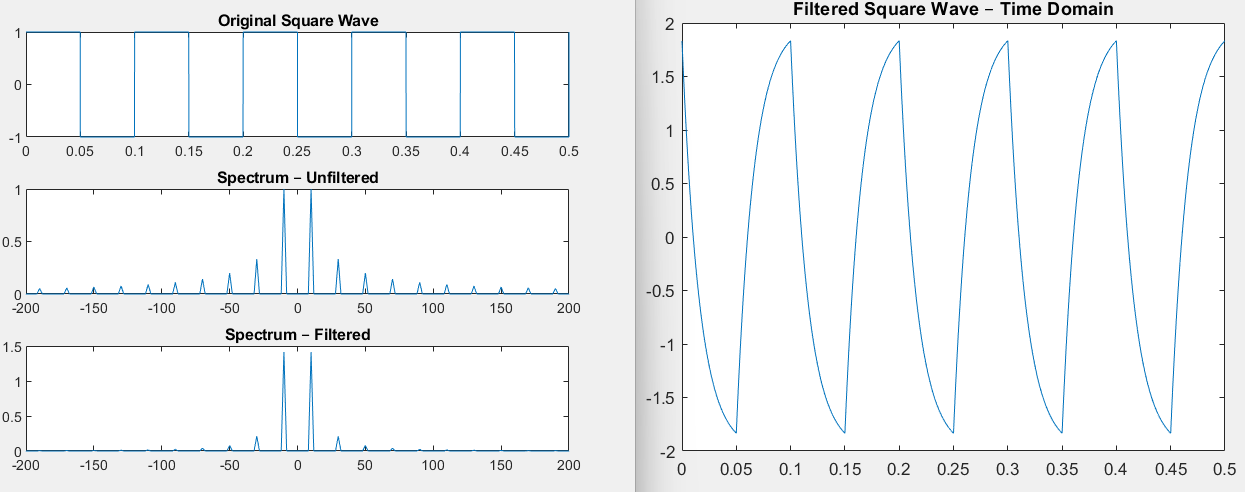
The Lab 13 process transforms a signal with an FFT, multiplies its spectrum by a filter transfer function, and transforms it back into the time domain. Tests included a 10 Hz low-pass cutoff, a 50 Hz high-pass cutoff, and a 10 Hz band-pass center with Q = 100. The band-pass exercise isolated the fundamental component of a synthetic square wave.
Reported measurements and observations
The values below are reported in the supplied lab write-ups. Filter cutoffs are described as design values; they are not presented as independently verified measurements.
| Investigation | Reported result |
|---|---|
| Differential gain test | A 30 mV peak-to-peak, 10 Hz sinusoidal input produced approximately 750 mV peak-to-peak output, corresponding to gain near 25. |
| Amplifier bandwidth | The Lab 14 report gives an approximate cutoff of 8 kHz. |
| Common-mode rejection | Reported common-mode gain was approximately 0.002, with calculated rejection near 82 dB. |
| High-pass design | Approximately 0.5 Hz cutoff with unity gain. |
| Low-pass design | Approximately 34 Hz cutoff with gain near 2. |
| Conditioned ECG | Lab 15 reports preservation of the ECG waveform with reduced baseline drift and high-frequency noise; quantitative comparisons are not supplied. |
Related MATLAB signal-processing work
In Lab 13, separate from the acquired ECG, MATLAB exercises used FFT-based filtering on synthetic sine and square waves. Low-pass, high-pass, and band-pass responses were examined in the time and frequency domains.
The report describes stronger attenuation of higher square-wave harmonics in the low-pass exercise and isolation of a 10 Hz component using a high-Q band-pass response. These exercises provide supporting signal-processing experience without implying completed MATLAB analysis of the recorded ECG.
Design considerations and lessons
Gain and headroom
Lab 14 highlights the need to amplify a small signal while avoiding output saturation. Lab 15 uses unity gain in the high-pass stage and additional gain in the low-pass stage.
Analog filtering before sampling
The reports connect baseline conditioning and high-frequency attenuation to preparing a signal for acquisition. Digital filtering cannot substitute for controlling aliasing before sampling.
Evidence to add
Original circuit photographs, ECG traces, measured filter response, actual sampling settings, and before/after comparisons.
Further reflection
Individual responsibilities, debugging examples, and improvements for a future version.
Source material
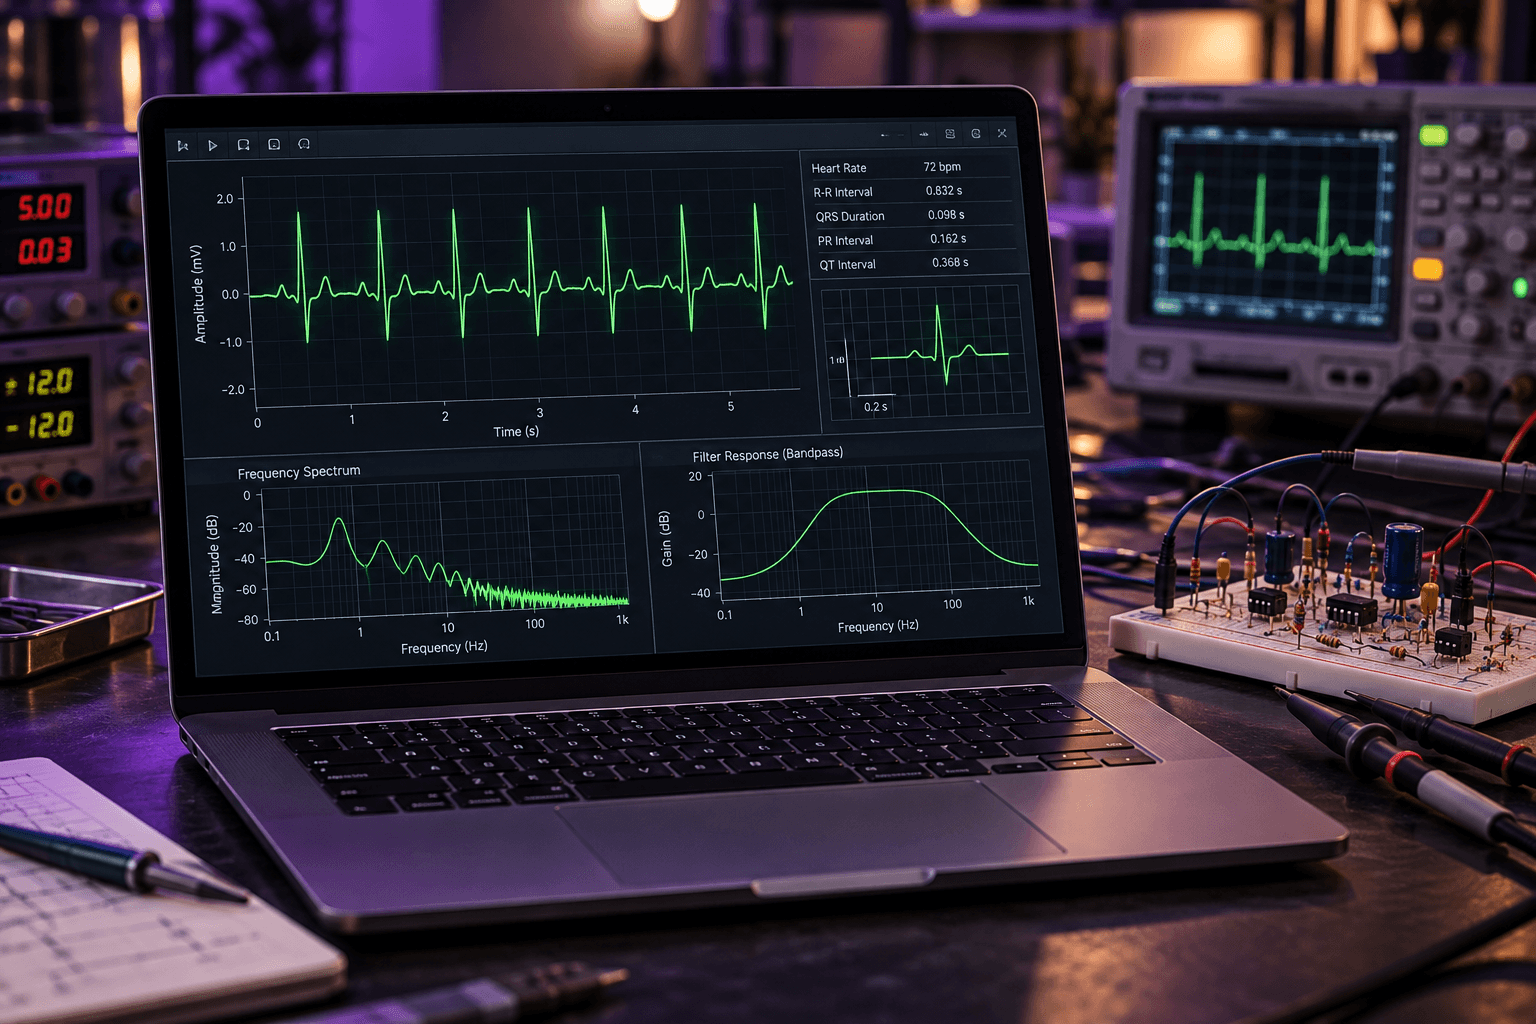
Based on Justin Ho’s EECE 2150 Lab 8, Lab 10, Lab 13, Lab 14, and Lab 15 reports. The MATLAB plot is an original Lab 13 asset from synthetic-signal work. The scene at the top of this page is illustrative; it is not a photograph or measured trace from these labs.